ELYADAL web edition ·
Read the number behind a journal metric
Before asking whether a number is high, ask what it counts, which year it describes and whose work it can actually represent.

Fictional calculation: 120 citations divided by 40 items and 60 divided by 20 both equal 3.0. Individual papers can differ; four papers with 9,1,1,1 citations also average 3.
1. Identify the unit before comparing numbers
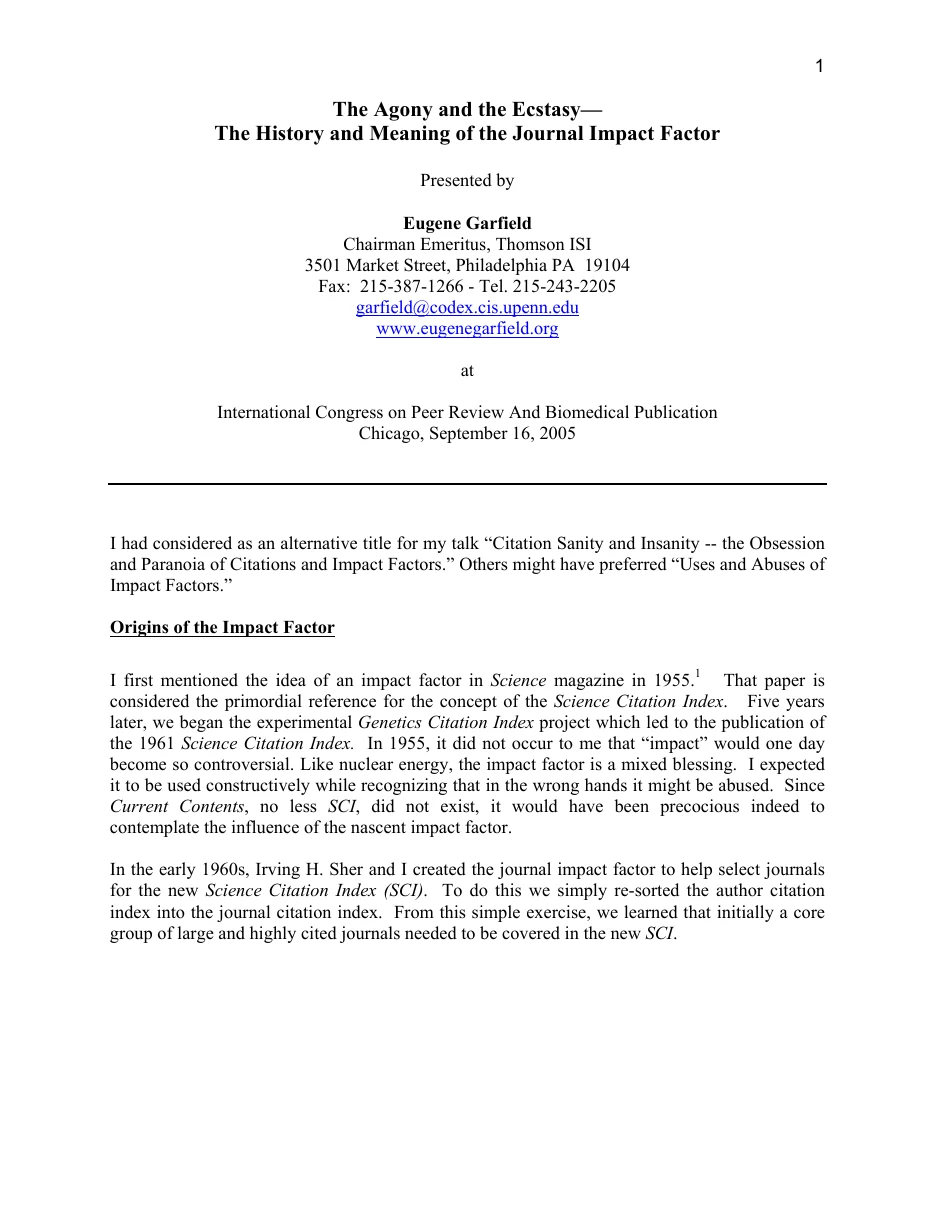
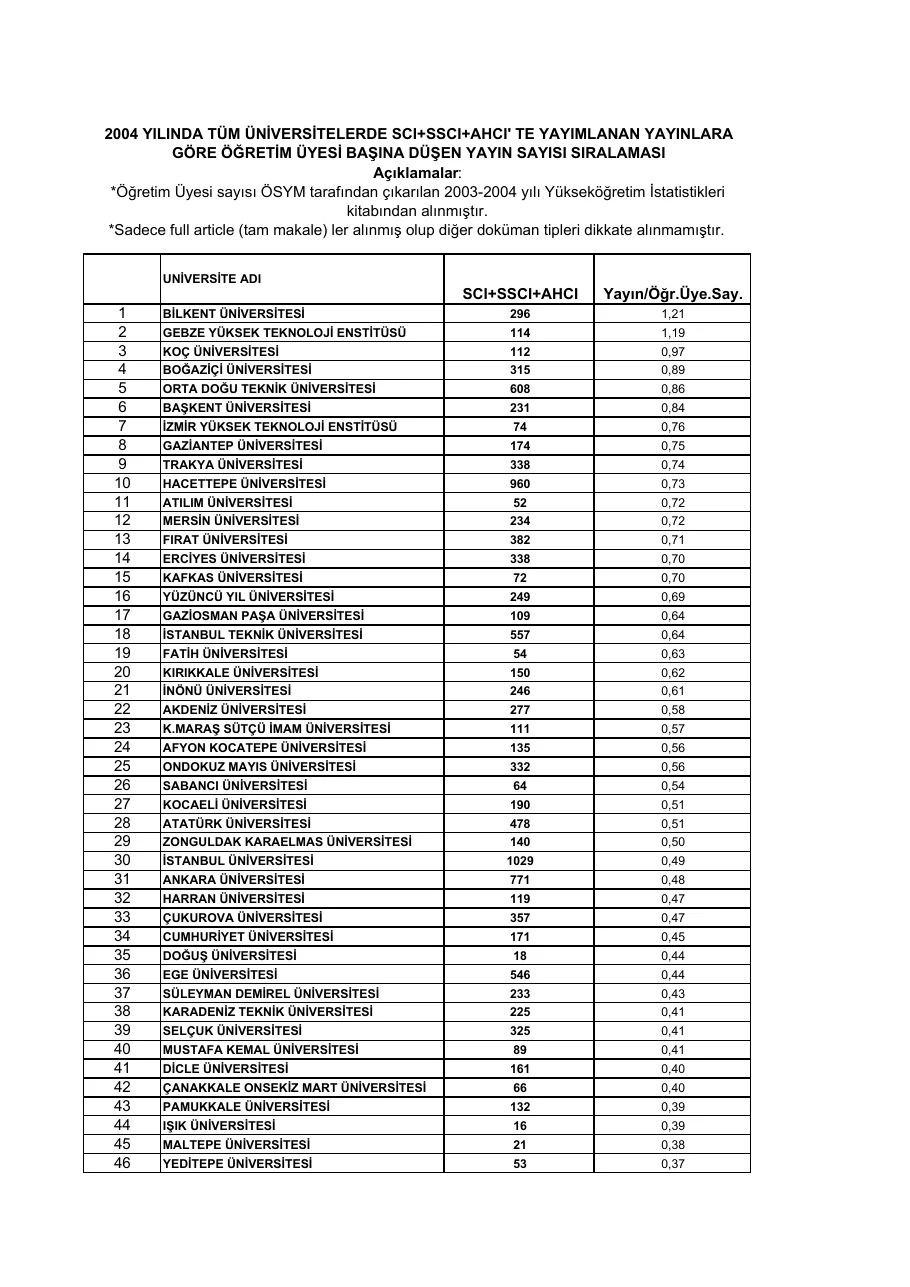
Three recovered documents answer different questions. Eugene Garfield’s 22-page talk, delivered in Chicago on 16 September 2005, explains the history and interpretation of journal impact factors. A two-page Turkish table reports 2004 full-article output per faculty member, using faculty figures from 2003–2004. The 19-page Thomson Scientific list records SSCI journal titles and ISSNs for 2005. None is a current ranking or a list of today’s index coverage.
Write the object, year, numerator, denominator and inclusion rule beside any metric. A journal ratio, a university output ratio and an article’s evidence belong to different units of analysis. A number without those details cannot settle a comparison.
2. Reproduce the calculation without overstating it
On page 5, Garfield distinguishes citations in a given year to a journal’s preceding two years of content from the source items used in the denominator. The following simplified exercise uses fictional figures and is not an official JCR calculation.
Journal A has 120 counted citations and 40 included items: 120 ÷ 40 = 3.0. Journal B has 60 and 20: 60 ÷ 20 = 3.0. The same ratio does not mean the same number of articles or citations. It also tells you nothing about the methods of the individual article you want to read.
For a smaller distribution example, four fictional papers receive 9, 1, 1 and 1 citations. Their mean is 12 ÷ 4 = 3, but three papers have one citation and none has three. A mean is not the result of every paper.
For an actual metric, consult its current provider definition and reported data. Do not substitute all historical citations or all published pages into a calculation that uses a defined year and document types.
3. Read the 2004 table within its boundary
The university table specifies SCI + SSCI + AHCI and includes full articles only. Its faculty denominator comes from a different stated academic period. The table reports, for example, 296 articles and 1.21 articles per faculty member for Bilkent. Those are historical entries, not a judgement about a university in 2026.
Do not divide 296 by the rounded 1.21 and publish the result as an exact staff count. Rounding prevents that inference. The table also does not establish the quality, openness or reproducibility of those articles. Keep its institutional names as printed when describing this historical source.
4. Verify the journal and read the paper
- Take the exact title and ISSN from the paper or publisher. The 2005 list can help identify a historical title; it cannot prove current coverage.
- Check the journal’s present record in Clarivate’s Master Journal List and record the date and collection shown. Distinguish present coverage from coverage for a particular publication year.
- Check the publisher’s actual scope, editorial policies and applicable charges before making a submission decision.
- Read the paper’s question, sample, method, results and limitations. Use the research reading worksheet rather than the journal label as your assessment.
- Write an article-specific judgement and an unanswered question.
DORA recommends assessing research on its own merits and avoiding journal metrics as a substitute for judging an individual article or researcher. That recommendation is distinct from Garfield’s historical account. This page does not verify the current index status of any individual journal.
A completed decision record
Fictional record: “I have a 2005 list entry and a 2004 institutional ratio. I have not checked current journal coverage. Neither document answers whether my chosen paper’s comparison group supports its conclusion. Next step: verify title/ISSN in the current register, then read the paper’s sampling and comparison sections.” This is a finished reading decision, not a recommendation of a university or journal.
Make your own record
Download the blank CSV and fill it on your own device. Completed records are not sent to this website. You can also copy the headings onto paper.
Download the blank CSV worksheetOpen the completed example record
- Object
- Journal ratio
- Year
- Record the actual year
- Numerator
- Counted citations
- Denominator
- Included items
- Coverage check
- Title; ISSN; collection; date
- Article question
- Which method supports which claim?
Sources and reading limits
Eugene Garfield · The Agony and the Ecstasy · 16 September 2005. The original document and the new editorial exercise are distinct. An archive capture date is not a publication date.
- agony.pdf
- 2004%20verileri.pdf
- ssci.pdf
- DORA · Declaration on Research Assessment
- Clarivate · Master Journal List
No new expert review or measured outcome is claimed.
Inspect the original page facsimile